
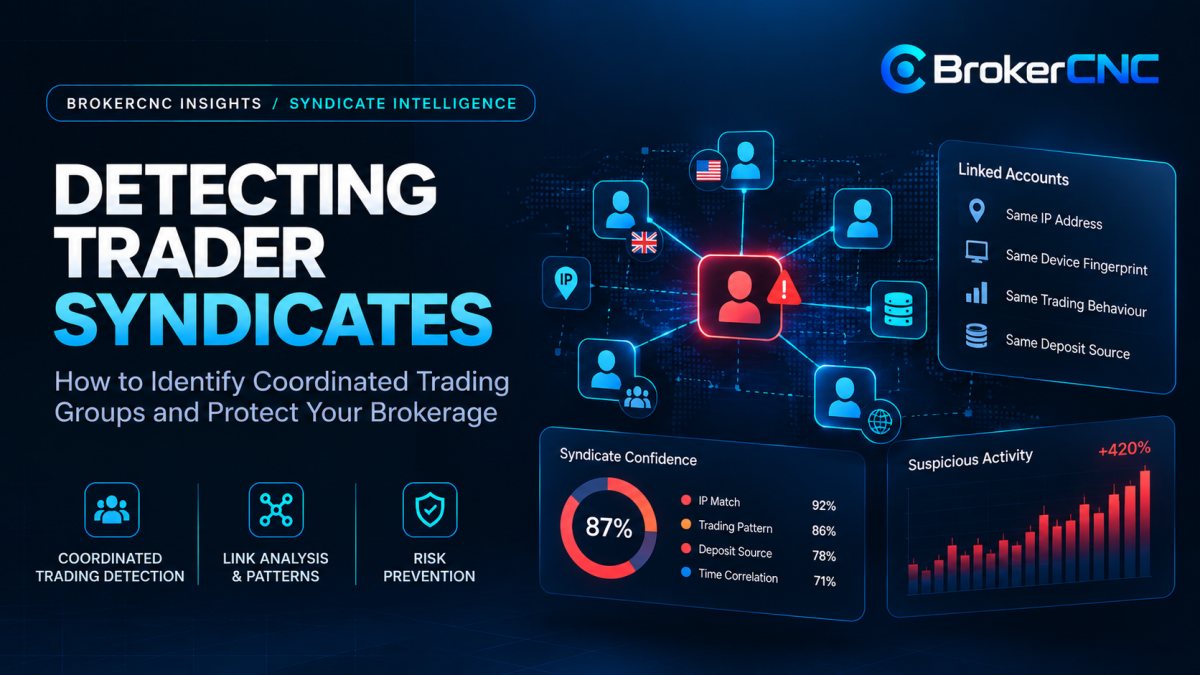
Linked-account analysis helps a brokerage see patterns that disappear when every account is reviewed separately. Repeated trades, shared infrastructure and concentrated financial outcomes can form a useful picture of activity across MT4 and MT5 servers.
The objective is an explainable investigation. A relationship indicator establishes a reason to look more closely; it does not automatically establish common ownership, coordinated intent or trading abuse.
Start with reliable account identities
Use an account key that includes the trading server as well as the login. The same numeric login can exist in different environments. Keep account records, trade references and observation times connected so a reviewer can follow the evidence without confusing two distinct accounts.
Identify the time window being analysed. An IP address shared today and an address shared months ago can have different significance. A graph should explain when a relationship was observed and how frequently it recurred.
Treat infrastructure as one layer of evidence
IP addresses, devices and subnets can reveal relationships worth investigating. Their usefulness depends on how they were collected, how stable they are and the surrounding operating context.
Shared offices, mobile networks, VPN services and shared connectivity can produce common IP observations. A device identifier can be more specific, but its reliability still needs assessment. A subnet describes a wider network range and should carry less evidential weight than an independently corroborated account relationship.
- Retain the original observation and timestamp.
- Distinguish direct matches from relationships inferred through another account.
- Record whether identifiers change or recur.
- Explain data coverage and unavailable sources.
Add behaviour to the relationship graph
Compare instruments, direction, volume, entry and exit timing, and recurring sequences. Ask whether similarities persist across sessions rather than relying on one coincident trade. A public news event or shared trading signal can explain correlated activity among independent clients.
Opposing trades can also deserve attention when they recur across connected accounts, but apparent offsetting activity needs careful reconstruction. Partial fills, changes in position size and different contract specifications can make two trades look more closely matched than they are.
Six accounts show repeated entries in the same instruments. Four share a recurring device observation, and three show closely matched exit sequences. The analyst checks the source records and a comparable event window before deciding whether the combined pattern supports escalation.
Make each connection understandable
Label the edges of the graph: shared device, shared address, repeated timing pattern or another observed relationship. Avoid a single unexplained confidence number. A reviewer should be able to inspect the observations behind each connection and understand which signals overlap.
Take care with indirect links. If account A shares a network with B, and B shares a different device with C, that does not prove A and C share the same device. Showing the path preserves the distinction between direct evidence and a broader connected group.
Measure the group’s brokerage impact
After resolving the network, review its combined trading outcome, exposure and book allocation. Identify which accounts contribute to retained market risk and which flow is externally routed. Keep deposits and withdrawals distinct from trading P/L; cash movement and trading result answer different questions.
Describe the impact using a consistent broker or client perspective. A network’s client profit is not automatically the brokerage’s trading loss where some activity is externally hedged.
Keep the review accountable
Limit access to relationship data to appropriate reviewers, record the purpose of the analysis and maintain retention rules suited to your business obligations. Preserve an investigation trail with observations, decisions and reasons for closing a case.
Review false positives and changes in data coverage. A model trained to highlight repeated timing may produce more alerts during unusually active sessions. Reassessing the rule is part of the operating process, not a failure of the investigation.
BrokerCNC’s Syndicate Intelligence demo brings shared infrastructure and trading patterns into a relationship graph. The Investigation Center shows how a desk can review the evidence and its associated workflow.
See the workflow in BrokerCNC.
Explore the product demo, then discuss your servers, routing and brokerage priorities with our team.
Book a Live Demo →